Weather guide
Why weather forecasts disagree—and how to choose a source
Weather apps can disagree because they begin with different observations, models, update cycles, and processing. Compare sources against the weather decisions that matter where you live.
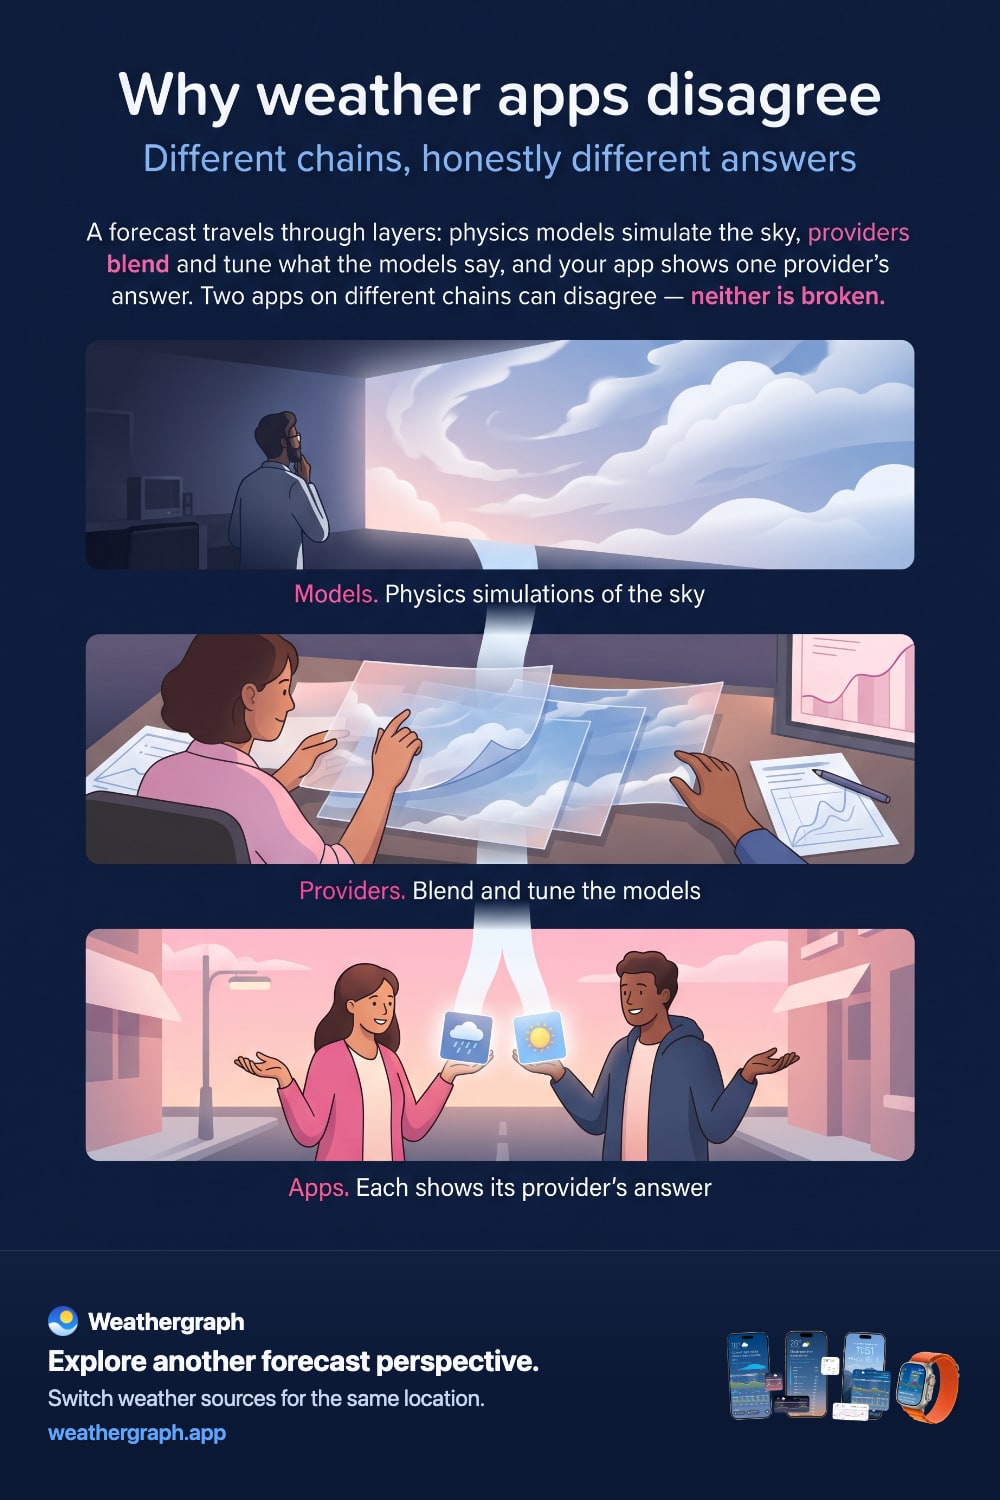
Two weather apps can show different temperatures or rain times without either one inventing data. They may use different observations, forecast models, model runs, corrections, or ways of translating a grid forecast to your exact location. The useful response is not to hunt for one source that is “most accurate everywhere,” but to learn which source handles the weather events that matter in your area.
The short answer
- A model is a mathematical simulation of the atmosphere. Different models divide the atmosphere differently and make different approximations.
- A provider turns model and observation data into a forecast product. It may blend models, apply local corrections, or add nowcasting.
- An app chooses and presents provider data. It decides units, time intervals, summaries, interpolation, and which uncertainty signals remain visible.
- Every forecast has uncertainty. Small differences in the estimated starting atmosphere and in model construction grow with time.
ECMWF identifies uncertainty in initial conditions and necessary model approximations as two reasons forecast skill generally decreases with lead time. Its ensemble system runs variations to estimate a range of possible outcomes. Read ECMWF's explanation.
Model, provider, and app are different layers
| Layer | What it does | Why two forecasts can diverge |
|---|---|---|
| Observations and initial analysis | Estimate the atmosphere's current state from satellites, stations, radar, balloons, and other inputs | Coverage, timing, and assimilation methods differ. |
| Numerical model | Calculates how the atmosphere may evolve | Resolution, physics, terrain, and initial conditions differ. |
| Forecast provider | Selects or blends model output and may post-process it | Providers use different recipes, local corrections, and update schedules. |
| Weather app | Requests, converts, summarizes, and displays the data | Apps can use different providers, time buckets, rounding, icons, and wording. |
When comparing two apps, first check whether you are actually comparing the same valid time, location, unit, and weather quantity. “Rain at 16:00” may mean an hourly amount beginning at 16:00 in one display and ending at 16:00 in another.
Why the forecast changes after an update
A forecast is rerun as new observations arrive. A later run can move a rain band, deepen a low-pressure system, or revise cloud cover. That change is evidence that the forecast has incorporated new information, not proof that forecasting is pointless.
The farther ahead the event, the more attention you should give to the broad pattern and the spread of plausible outcomes. As the event approaches, observations and short-range tools can give the forecast a better starting point—but small, fast-forming showers can still be difficult to place precisely.
A practical way to choose a source for your area
Do not judge a source from one memorable miss. Run a small, decision-based comparison:
- Name the job. Examples: rain start for cycling, overnight minimum for a garden, coastal wind for sailing, or cloud breaks for photography.
- Pick two or three sources available in your location. Keep the app, unit, location, and display interval constant if possible.
- Record the forecast before the event. Note the source, model-run/update time if available, and the exact horizon—six hours ahead is not comparable to five days ahead.
- Record what you observed. A nearby official station is useful for temperature and wind; radar and a rain gauge help with precipitation, while remembering that one point may miss a nearby shower.
- Repeat across 10–20 relevant events. Include the weather types you actually plan around, not only dramatic misses.
- Prefer the source that improves your decisions. Consistent timing or fewer false rain alarms may matter more to you than the smallest average temperature error.
Keep separate notes by horizon. A source that handles today's convective showers well may not be the one you prefer for a seven-day temperature trend.
Forecast sources in Weathergraph
Weathergraph currently exposes several sources depending on region, including Foreca, yr.no, Apple Weather, Open-Meteo, Pirate Weather for the US and Canada, and US National Weather Service data. Availability and the underlying inputs can change, so the source selector in the current app is the product truth.
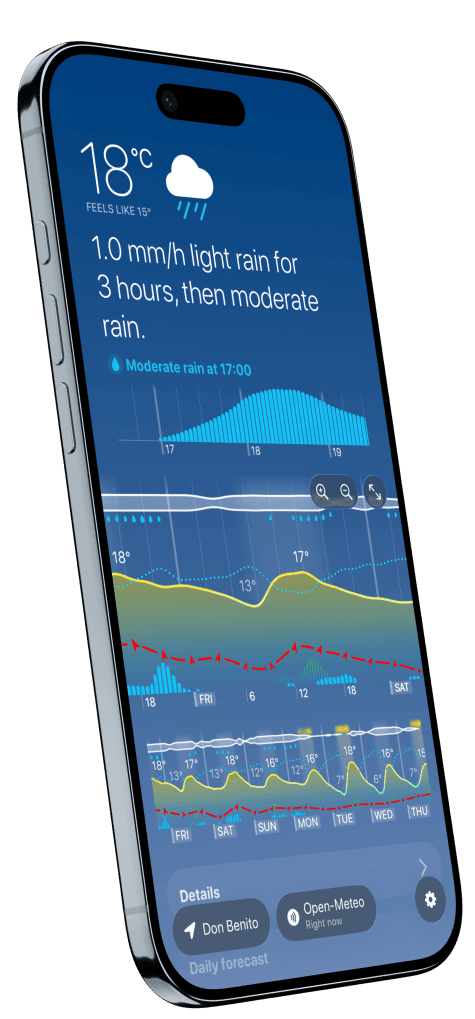
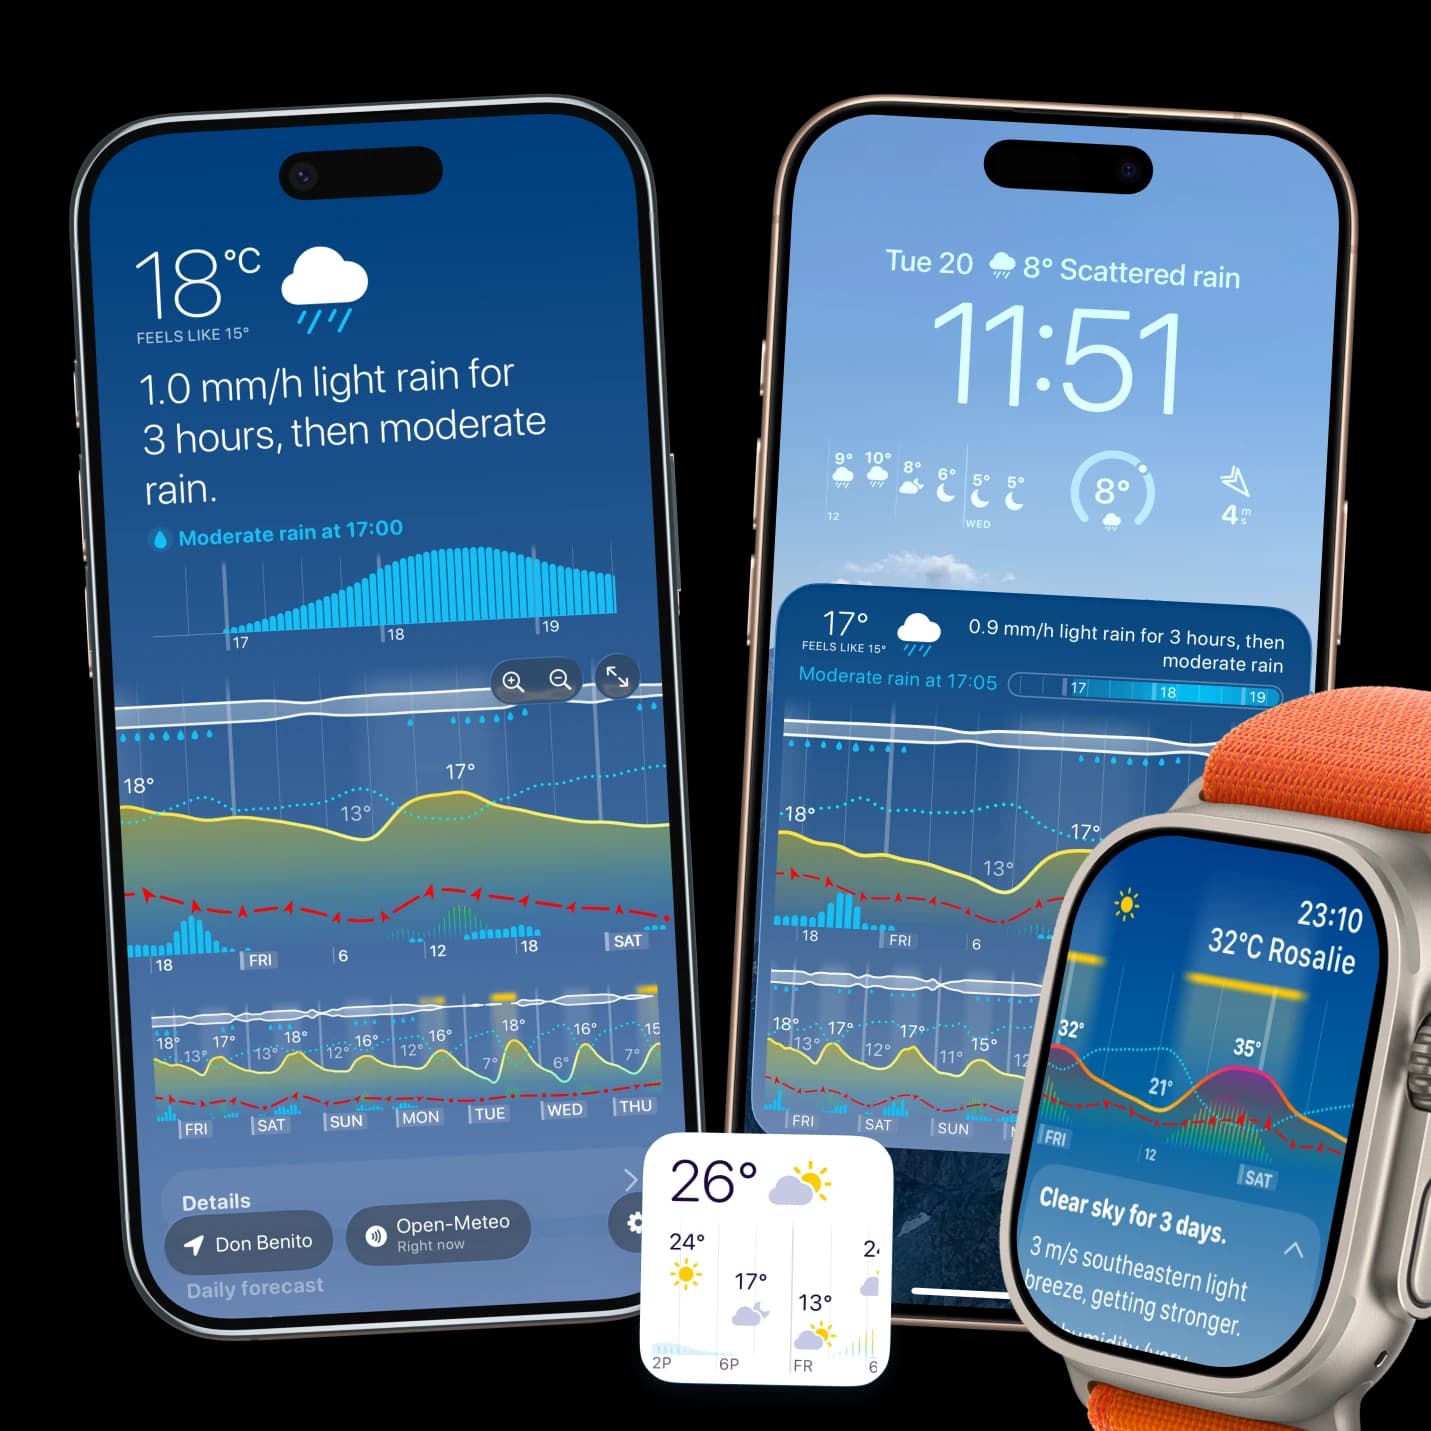
The benefit of switching sources inside Weathergraph is a controlled comparison: the graph style, units, location, and selected metrics stay familiar while the forecast changes. You can look for meaningful differences in rain timing, temperature trends, wind, or cloud cover instead of comparing two entirely different interfaces.
With Pro, Superforecast compares multiple forecast models at once, helping you see their agreement and spread. That comparison does not automatically prove which source is best for your exact location. Source choice gives you agency; it does not remove forecast uncertainty.
What to send when a forecast looks implausible
A useful report includes the location, local date and time, selected source, screenshot, the value that looked wrong, and what you observed or compared it with. “The forecast was wrong” is understandable frustration, but those details are what make diagnosis possible.
If the mismatch is between two Weathergraph surfaces using the same source and time, it may be a presentation or refresh defect rather than ordinary model disagreement. Contact Weathergraph support so it can be investigated.
Sources and limits
- ECMWF on forecast uncertainty explains uncertainty from initial conditions and model approximations.
- ECMWF on data assimilation explains how observations help estimate the atmosphere's starting state.
- Weathergraph's currently documented source list is available in the Weathergraph FAQ.
- No general guide can identify a universally best source. Verify safety-critical decisions with the relevant official authority and current observations.
What changed in this review
Reviewed on 20 October 2026: added Superforecast as the Pro option for comparing multiple models. The comparison method above is a way to collect your own evidence, not a published accuracy test.
Weathergraph
Compare forecast sources in the same view
Weathergraph lets you switch among available forecast sources while keeping the graph and your chosen metrics consistent—so you can compare the forecast, not relearn the app.
