Weather guide
Dew point vs. humidity: how muggy will it feel?
Dew point gives a steadier read of moisture in the air than relative humidity. Learn how to use it to plan a hot day, without mistaking it for a heat-safety rating.
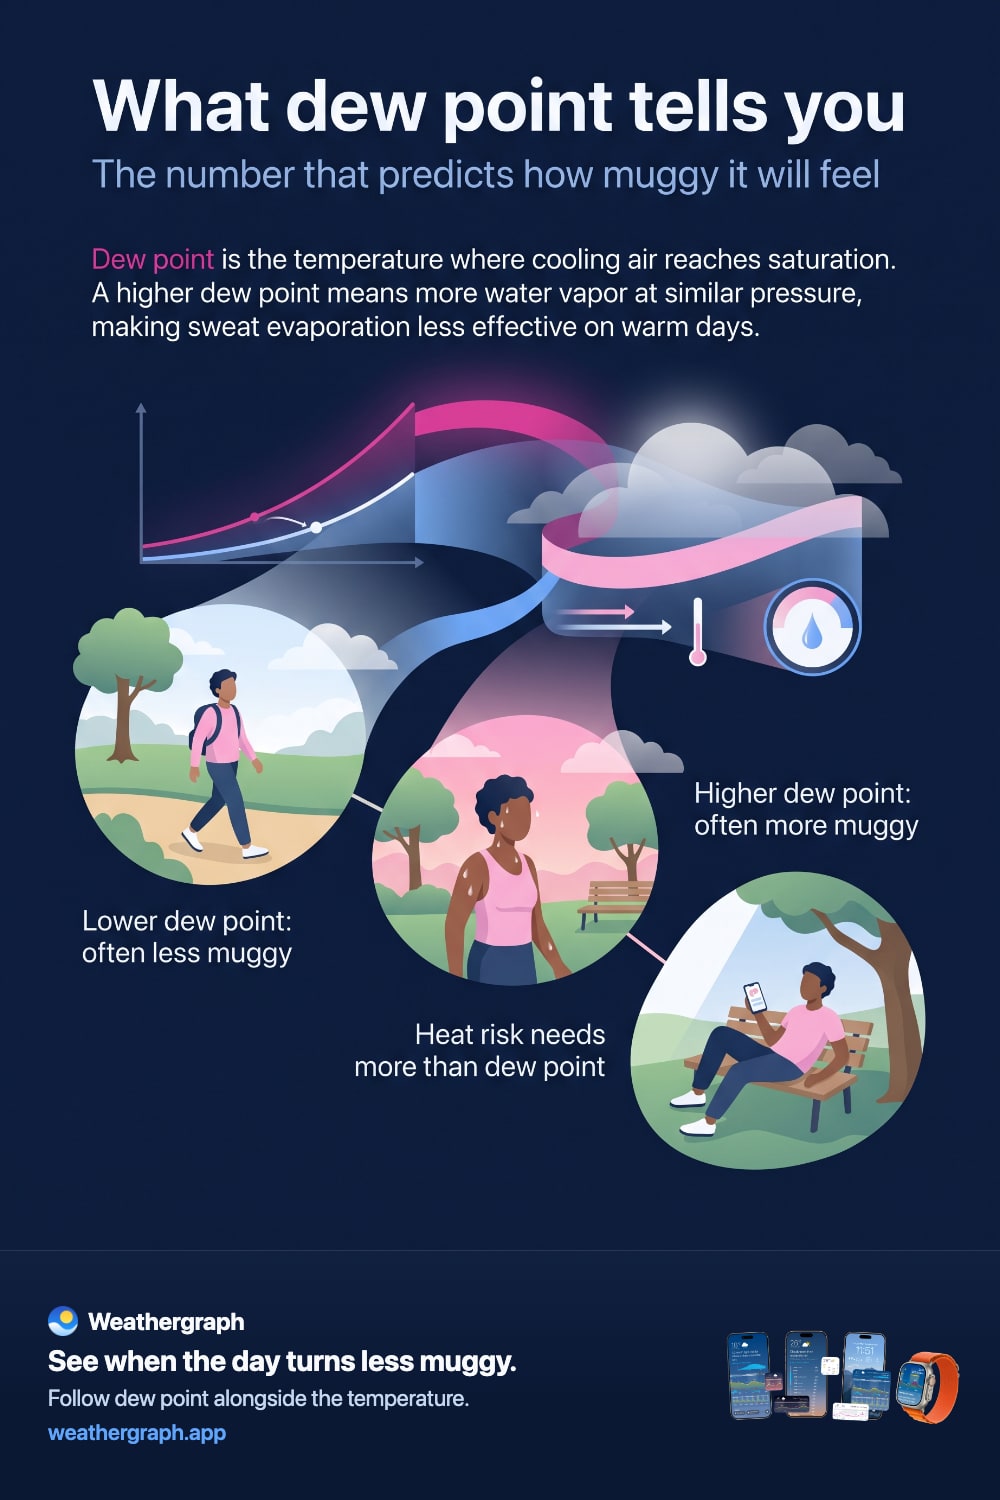
If you want to know whether the air will feel dry, sticky, or oppressive, look at the dew point as well as the temperature. Relative humidity is useful, but it changes with temperature; dew point is usually the clearer way to compare how much moisture is actually in the air.
The quick answer
- Dew point tells you about the air's moisture. A higher dew point usually means sweat evaporates less easily, so a warm day can feel more muggy.
- Relative humidity is a percentage, not a direct comfort score. The same amount of moisture can produce a high percentage on a cold day and a much lower percentage on a warm one.
- Use dew point to plan comfort, not to judge safety on its own. For heat risks, check local official warnings and heat guidance as well as the forecast.
Weathergraph's comfort labels are a practical orientation aid. People respond to heat differently, and temperature, sun, wind, activity, acclimatization, and health all matter too.
Why 40% humidity can still feel muggy
Relative humidity compares the water vapor currently in the air with the most that air could hold at its current temperature. Warm air can hold more water vapor than cold air. That means a warm day with 40% relative humidity can contain more moisture—and feel much muggier—than a cool day with 90% relative humidity.
Dew point answers a different question: how far would the air need to cool before moisture condenses? Because it is tied more closely to the actual amount of water vapor, it is often easier to compare from one warm day to the next. The US National Weather Service explains that higher dew points mean more atmospheric moisture and less efficient evaporative cooling from sweat. Read its dew point explanation.
A practical comfort guide
These ranges are deliberately approximate. They help you notice a trend, not diagnose how your body will respond.
| Dew point | What many people notice | A useful planning question |
|---|---|---|
| Below 10 °C / 50 °F | Air often feels dry or crisp | Will the day warm up enough that dry air is a comfort? |
| 10–16 °C / 50–60 °F | Often comfortable for ordinary outdoor time | When is the coolest, calmest part of the day? |
| 16–21 °C / 60–70 °F | Air can start to feel sticky, especially with heat or exertion | Can I move a walk, run, or errand to a cooler hour? |
| Above 21 °C / 70 °F | Air often feels very humid or oppressive | What do the local forecast and official heat guidance say before I make strenuous plans? |
The exact labels differ by person and climate. A forecast is most useful when you compare the dew point with temperature, sunshine, wind, and the time you expect to be outside.
How to use dew point for a hot day
- Find the hours you care about. A daily icon cannot show whether the uncomfortable part of the day is early afternoon, the evening commute, or overnight.
- Read dew point with temperature. A high dew point can make a hot period feel more burdensome; lower dew points can make the same temperature feel more tolerable.
- Look for a weather window. A breeze, shade, falling temperature, or lower dew point can make one part of the day more pleasant than another.
- Check official heat information when heat is dangerous. Dew point is not a substitute for local heat advisories, warnings, or health guidance. The National Weather Service's heat tools and safety information provide the appropriate public-safety context.
Can dew point help with ventilation?
Yes: compare the outdoor dew point with the indoor dew point, using a current indoor temperature-and-humidity reading. At comparable pressure, lower outdoor dew point indicates drier incoming air. Compare temperatures separately if you also want to cool the room.
There is an extra check for cold cellars. Incoming air can be drier than the indoor air and still condense on a colder wall. Compare its dew point with the surface temperature as well.
Use the worked examples in when to open windows and when to ventilate a cellar. Indoor and surface readings are your own measurements; Weathergraph supplies the upcoming outdoor forecast.
Where to find dew point in Weathergraph
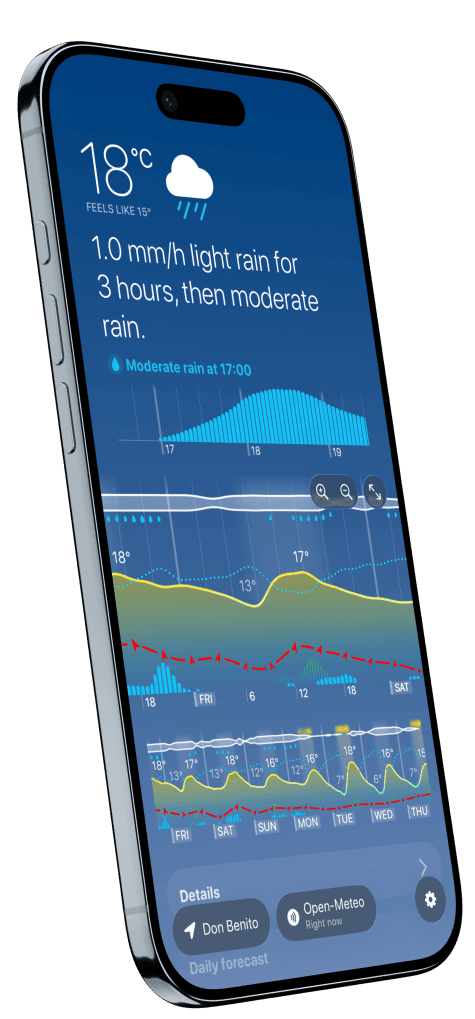
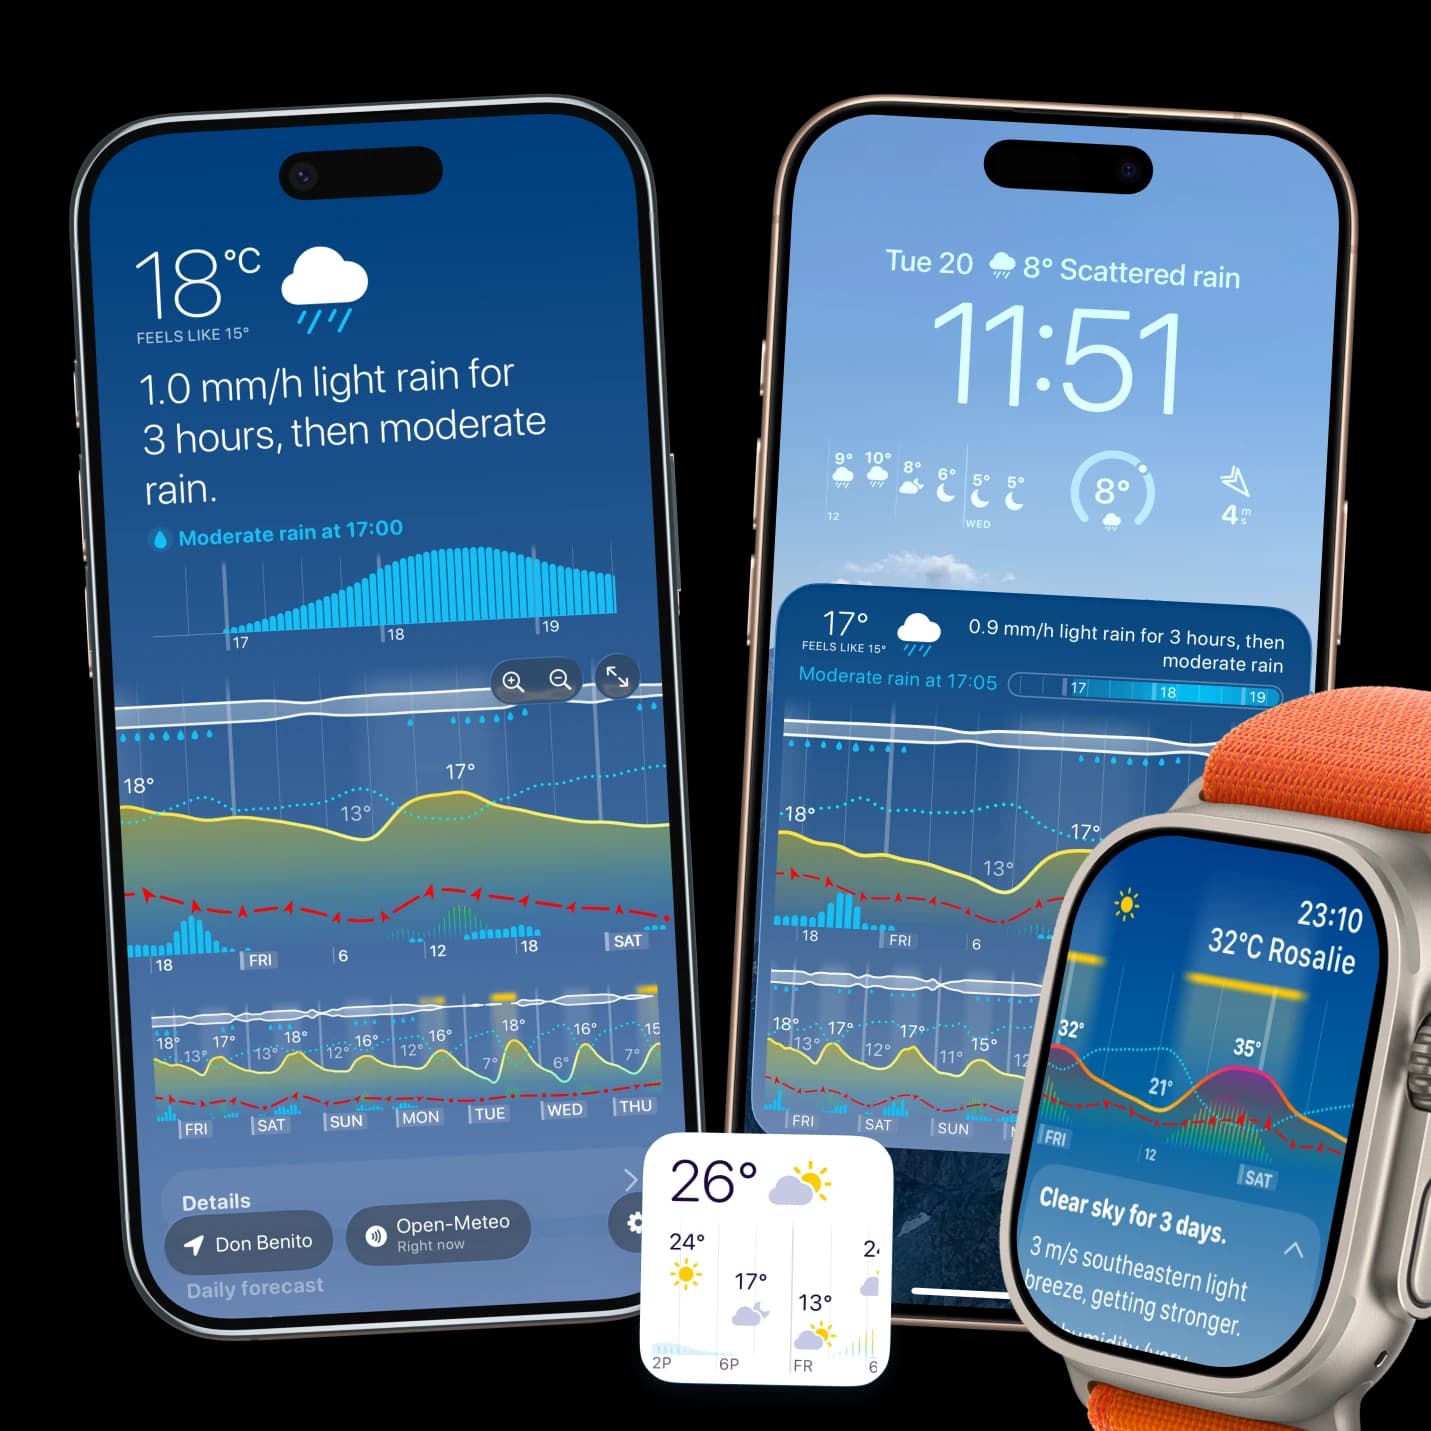
Weathergraph can show humidity or dew point as a dotted line in the weather graph. The graph puts that line beside temperature, rain, wind, sunshine, and cloud cover, so you can compare the conditions that matter for a particular hour rather than switching between separate screens.
For a visual explanation of the full graph, see the Weathergraph FAQ guide to reading the chart.
Sources and limits
- The US National Weather Service dew point explanation explains why higher dew points usually feel muggier and why sweat evaporates less efficiently in moist air.
- The National Weather Service heat-safety resources explain that heat risk depends on more than one weather variable and direct readers to official heat products.
- Weathergraph's labels are intended to make a forecast easier to read. They are not medical advice, a personal heat-risk assessment, or a substitute for local warnings.
Weathergraph
See when the air will feel heaviest
Weathergraph puts dew point beside temperature, sunshine, wind, and rain on one hourly timeline—so you can look for a more comfortable time to walk, run, sleep, or simply step outside.
