Weather guide
Weathergraph: the whole forecast at a glance
See hours and days as one visual timeline, keep the forecast close on iPhone and Apple Watch, and choose the detail and sources that matter to you.
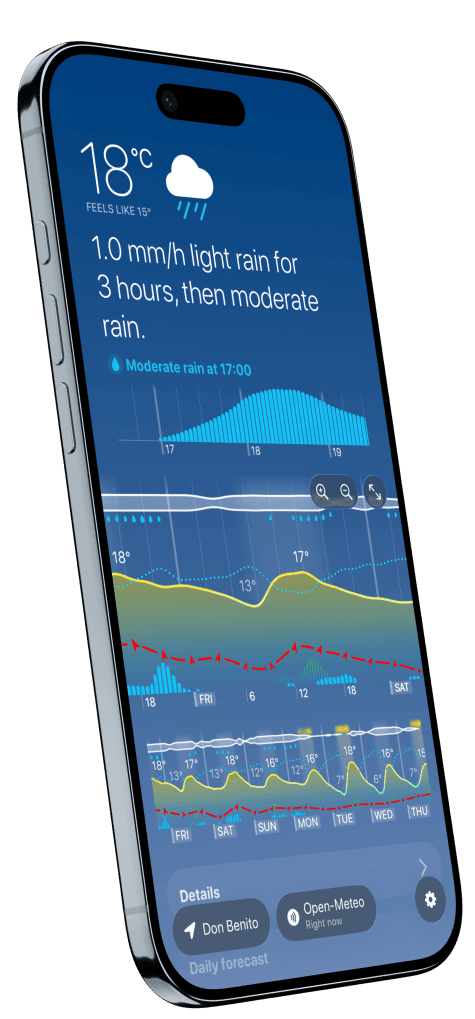
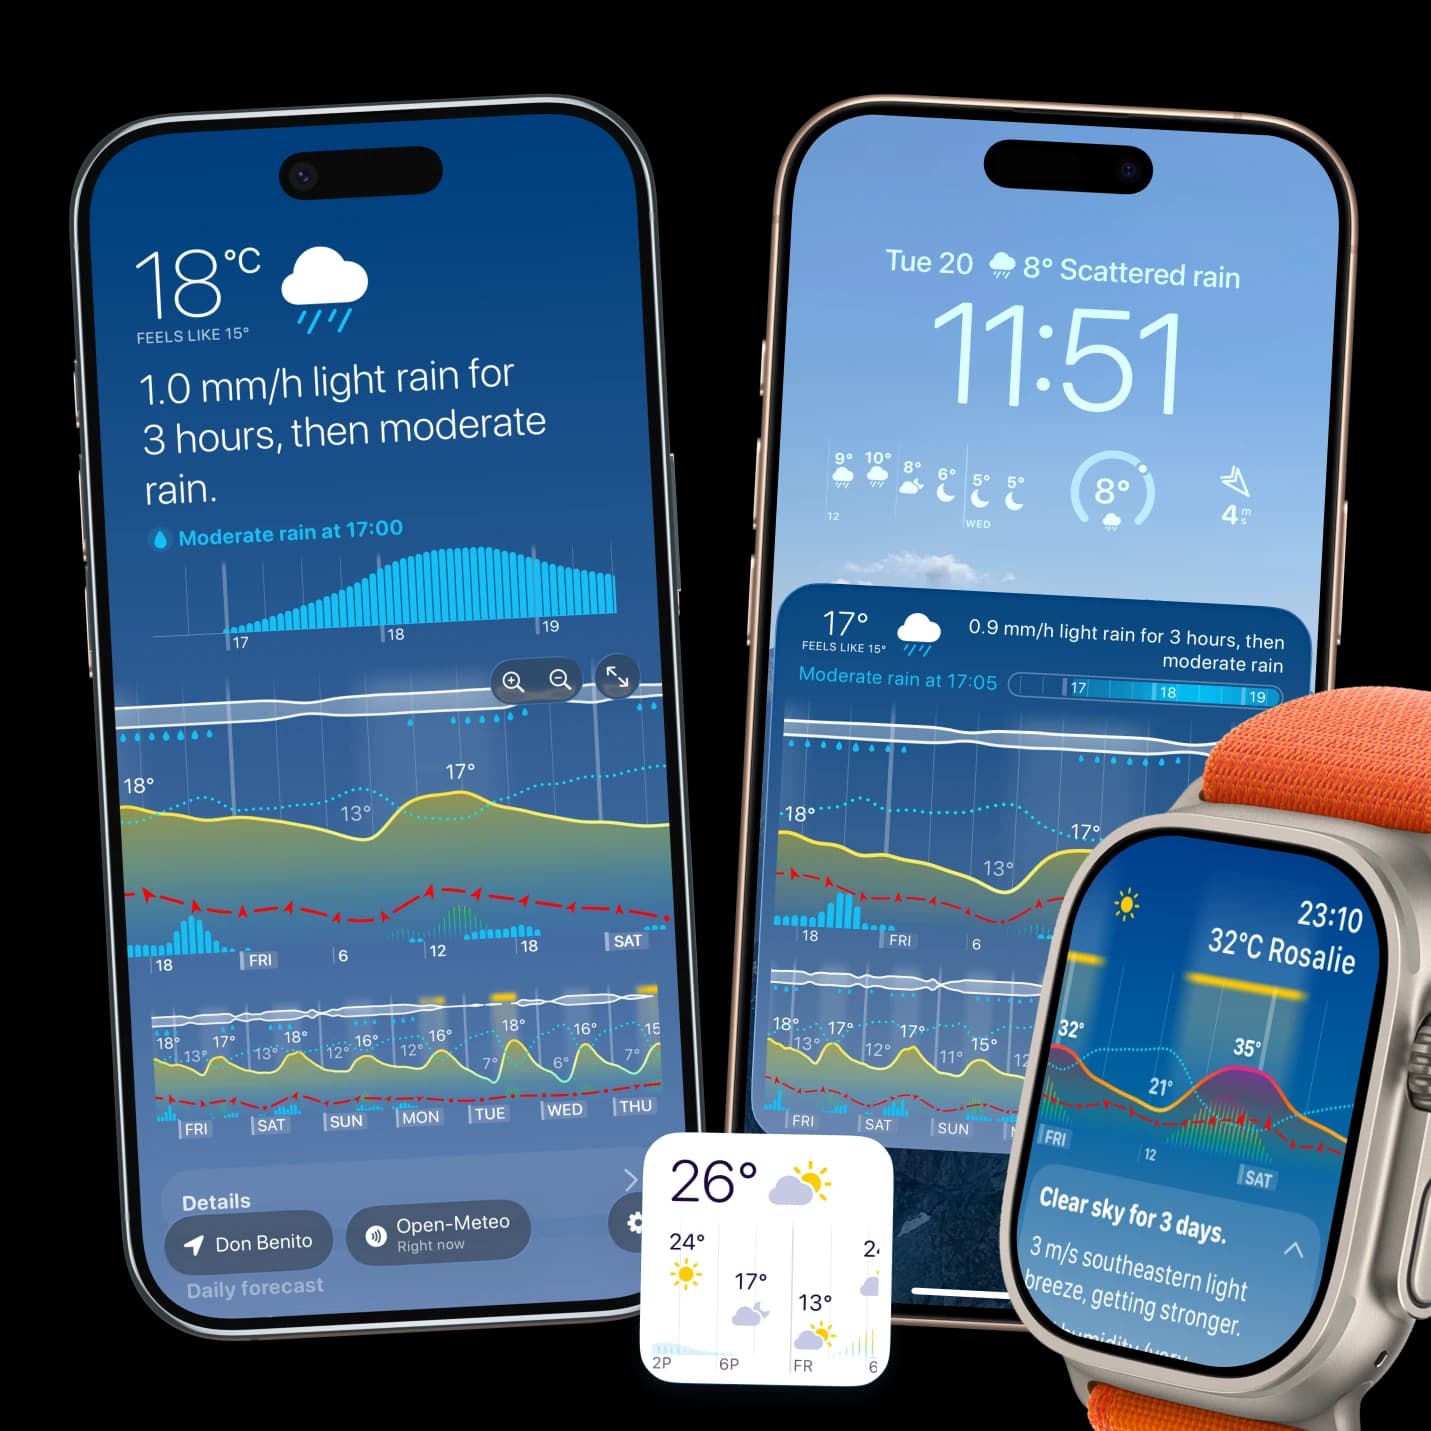
Weathergraph turns the next hours and days into one visual story. Instead of piecing together rows of numbers and separate charts, you can see temperature, rain, wind, clouds, sunshine, and the details you care about on the same timeline.
That makes the useful questions easier to answer: When does the rain begin? Will the wind build before I get home? Is there a cooler hour for a run? When will the clouds open?
See the shape of the day
A list tells you individual values. A graph reveals how they relate.
Weathergraph keeps time moving from left to right, so the direction and timing of a change become visible. A temperature curve can show the warmest part of the day. Rain bars can show whether a shower is brief or settled in. Wind, cloud, and sunshine layers add the context that a single weather icon leaves out.
You get a quick overview first, with precise hourly detail available when you want to look closer. For help reading each part, see how to read an hourly weather graph.
Keep the forecast where you look
Weathergraph carries the same visual forecast across iPhone, iPad, Apple Watch, and Mac. Widgets keep the next hours visible on your Home Screen or Lock Screen. Rich Apple Watch complications put changing conditions on your watch face, so a glance can tell you more than the current temperature.
Choose a compact graph when timing matters, or a focused complication when one detail—such as rain, wind, temperature, or dew point—is the thing you need most. The Apple Watch complication guide shows how to choose a useful setup.
Start with a glance. Go as deep as you like.
Weathergraph is designed to hold a lot of weather information without turning it into a wall of numbers. You decide which layers appear, how far ahead the graph looks, how it is styled, and which details deserve space.
That balance is the point: simple enough to check quickly, detailed enough to notice a pattern before it affects your plans.
Choose the forecast behind the graph
Weathergraph offers multiple professional forecast sources, with availability depending on your location and device. You can choose the source that works well for your region or compare how different forecasts describe the same hours.
The graph gives every source the same readable visual language. You spend less effort decoding a new interface and more time understanding where the forecasts agree and where uncertainty remains. Learn more in why weather forecasts disagree.
Turn weather into timing
Before a run, look for the cooler interval before temperatures climb. Before a ride, walk, or hike, see how rain and wind line up with the hours you expect to be outside. Before taking a photograph, follow cloud cover and sunshine together. When showers are close, combine the longer forecast with short-range precipitation information.
Weathergraph keeps the conditions that shape your decision in one place. The choice stays yours; the timing becomes easier to see.
Thoughtfully independent
Weathergraph is designed and developed by Tomas Kafka in the Czech Republic. It has no ads, requires no account, and does not use behavioral tracking. You can read the privacy policy or contact Weathergraph support whenever you need a real answer from the person responsible for the app.
Weathergraph
See the weather come together
Weathergraph turns temperature, rain, wind, clouds, sunshine, and the details you choose into one visual timeline—so the next useful window is easier to spot.
